Efficient Illumination
pyribs is the official implementation of Covariance Matrix Adaptation MAP-Elites (CMA-ME) and other quality diversity optimization algorithms.
Flexible Components
Every quality diversity (QD) algorithm in pyribs consists of three components.
from ribs.archives import GridArchive

archive = GridArchive(
    solution_dim=10,
    dims=[20, 20],
    ranges=[(-1, 1), (-1, 1)],
)The Archive is a data structure that stores solutions generated by the QD algorithm.
from ribs.emitters import EvolutionStrategyEmitter

emitters = [
    EvolutionStrategyEmitter(
        archive,
        x0=[0.0] * 10,
        sigma0=0.1,
        batch_size=36,
    ) for _ in range(3)
]Emitters generate new candidate solutions.
from ribs.schedulers import Scheduler

scheduler = Scheduler(archive, emitters)The Scheduler facilitates the interaction of the archive and emitters and acts as a scheduling algorithm for emitters.
Intuitive Usage
pyribs components come together in an intuitive ask-tell interface inspired by pycma.
import numpy as np

for itr in range(1000):
    solutions = scheduler.ask()

    # Optimize the 10D negative Sphere function.
    objectives = -np.sum(np.square(solutions), axis=1)

    # Measures: first 2 coordinates of each 10D solution.
    measures = solutions[:, :2]

scheduler.tell(objectives, measures)Insightful Visualizations
The pyribs visualize module integrates with Matplotlib to plot a heatmap of the archive after each experiment.
import matplotlib.pyplot as plt
from ribs.visualize import grid_archive_heatmap

grid_archive_heatmap(archive)
plt.show()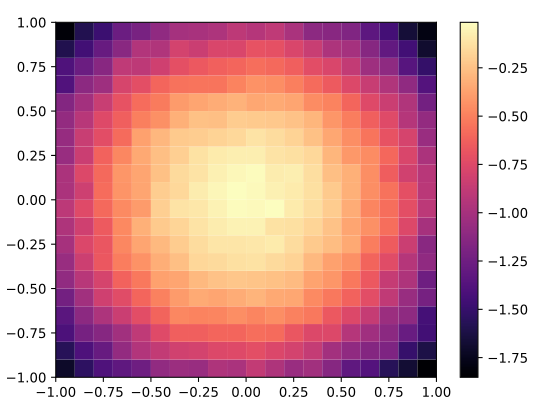
Easy Installation
pyribs supports Python 3.10 and above. The visualize distribution packages pyribs with visualization dependencies such as Matplotlib, while all includes all optional dependencies used by various components in pyribs. ribs[visualize] should be sufficient for most users.
Distribution
Package
Command
pip install ribs
# If you are on Mac, you may need to use quotations, e.g., pip install "ribs[visualize]"
pip install ribs[visualize]
# If you are on Mac, you may need to use quotations, e.g., pip install "ribs[all]"
pip install ribs[all]

# Note that this command installs a default version of PyTorch. You can also install
# PyTorch on your own, e.g., if you need a version with CUDA. Refer to the PyTorch
# documentation for more info on how to install PyTorch.
conda install -c conda-forge pyribs
conda install -c conda-forge pyribs-visualize
conda install -c conda-forge pyribs-all

# Note that this command installs a default version of PyTorch. You can also install
# PyTorch on your own, e.g., if you need a version with CUDA. Refer to the PyTorch
# documentation for more info on how to install PyTorch.
uv add ribs
# If you are on Mac, you may need to use quotations, e.g., uv add "ribs[visualize]"
uv add ribs[visualize]
# If you are on Mac, you may need to use quotations, e.g., uv add "ribs[all]"
uv add ribs[all]

# Note that this command installs a default version of PyTorch. You can also install
# PyTorch on your own, e.g., if you need a version with CUDA. Refer to the PyTorch
# documentation for more info on how to install PyTorch.
git clone https://github.com/icaros-usc/pyribs
cd pyribs
pip install .
git clone https://github.com/icaros-usc/pyribs
cd pyribs
pip install .[visualize]
git clone https://github.com/icaros-usc/pyribs
cd pyribs
pip install .[all]

# Note that this command installs a default version of PyTorch. You can also install
# PyTorch on your own, e.g., if you need a version with CUDA. Refer to the PyTorch
# documentation for more info on how to install PyTorch.
Comprehensive Tutorials
Learn more about pyribs in the tutorials. All tutorials are also available on Google Colab.
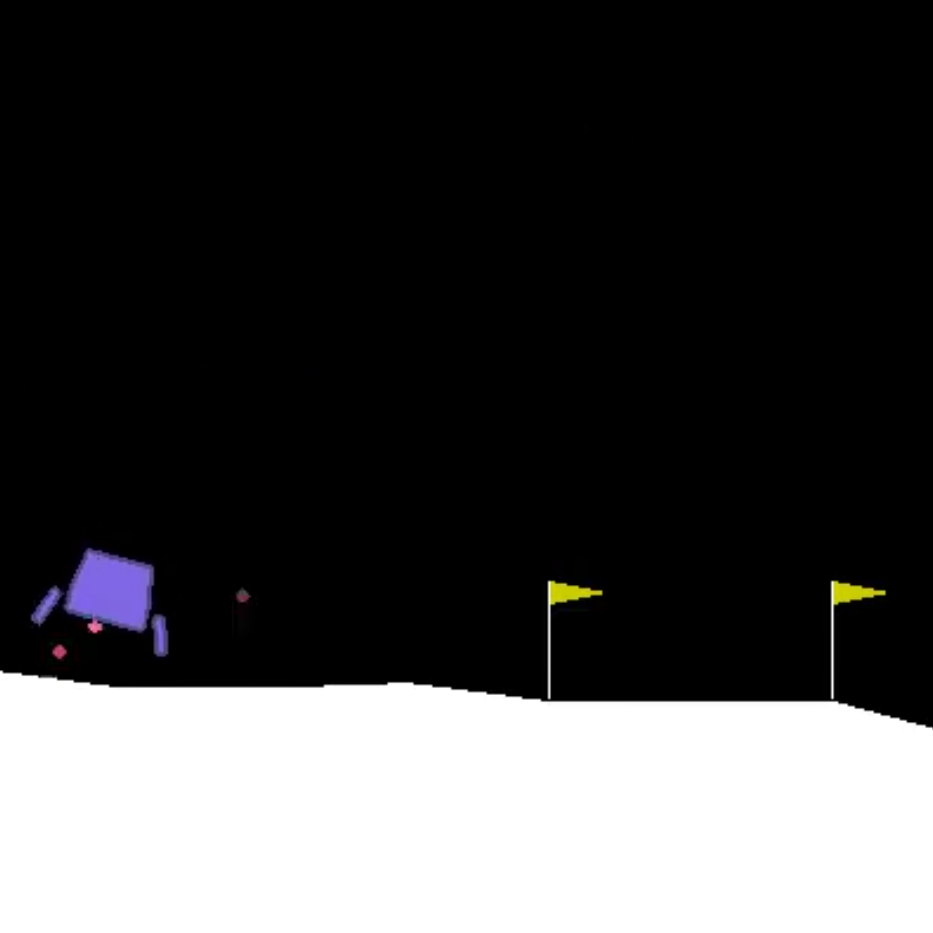
Using CMA-ME to Land a Lunar Lander Like a Space Shuttle

Upgrading CMA-ME to CMA-MAE on the Sphere Benchmark
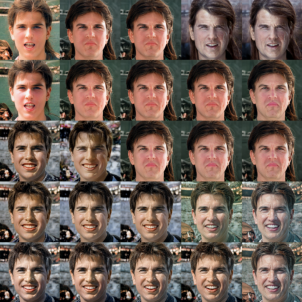
Generating Tom Cruise Images with Differentiable Quality Diversity

Exploring Deceptive Mazes with Novelty Search
Orchestrating LLMs to Write Diverse Stories with Quality Diversity through AI Feedback
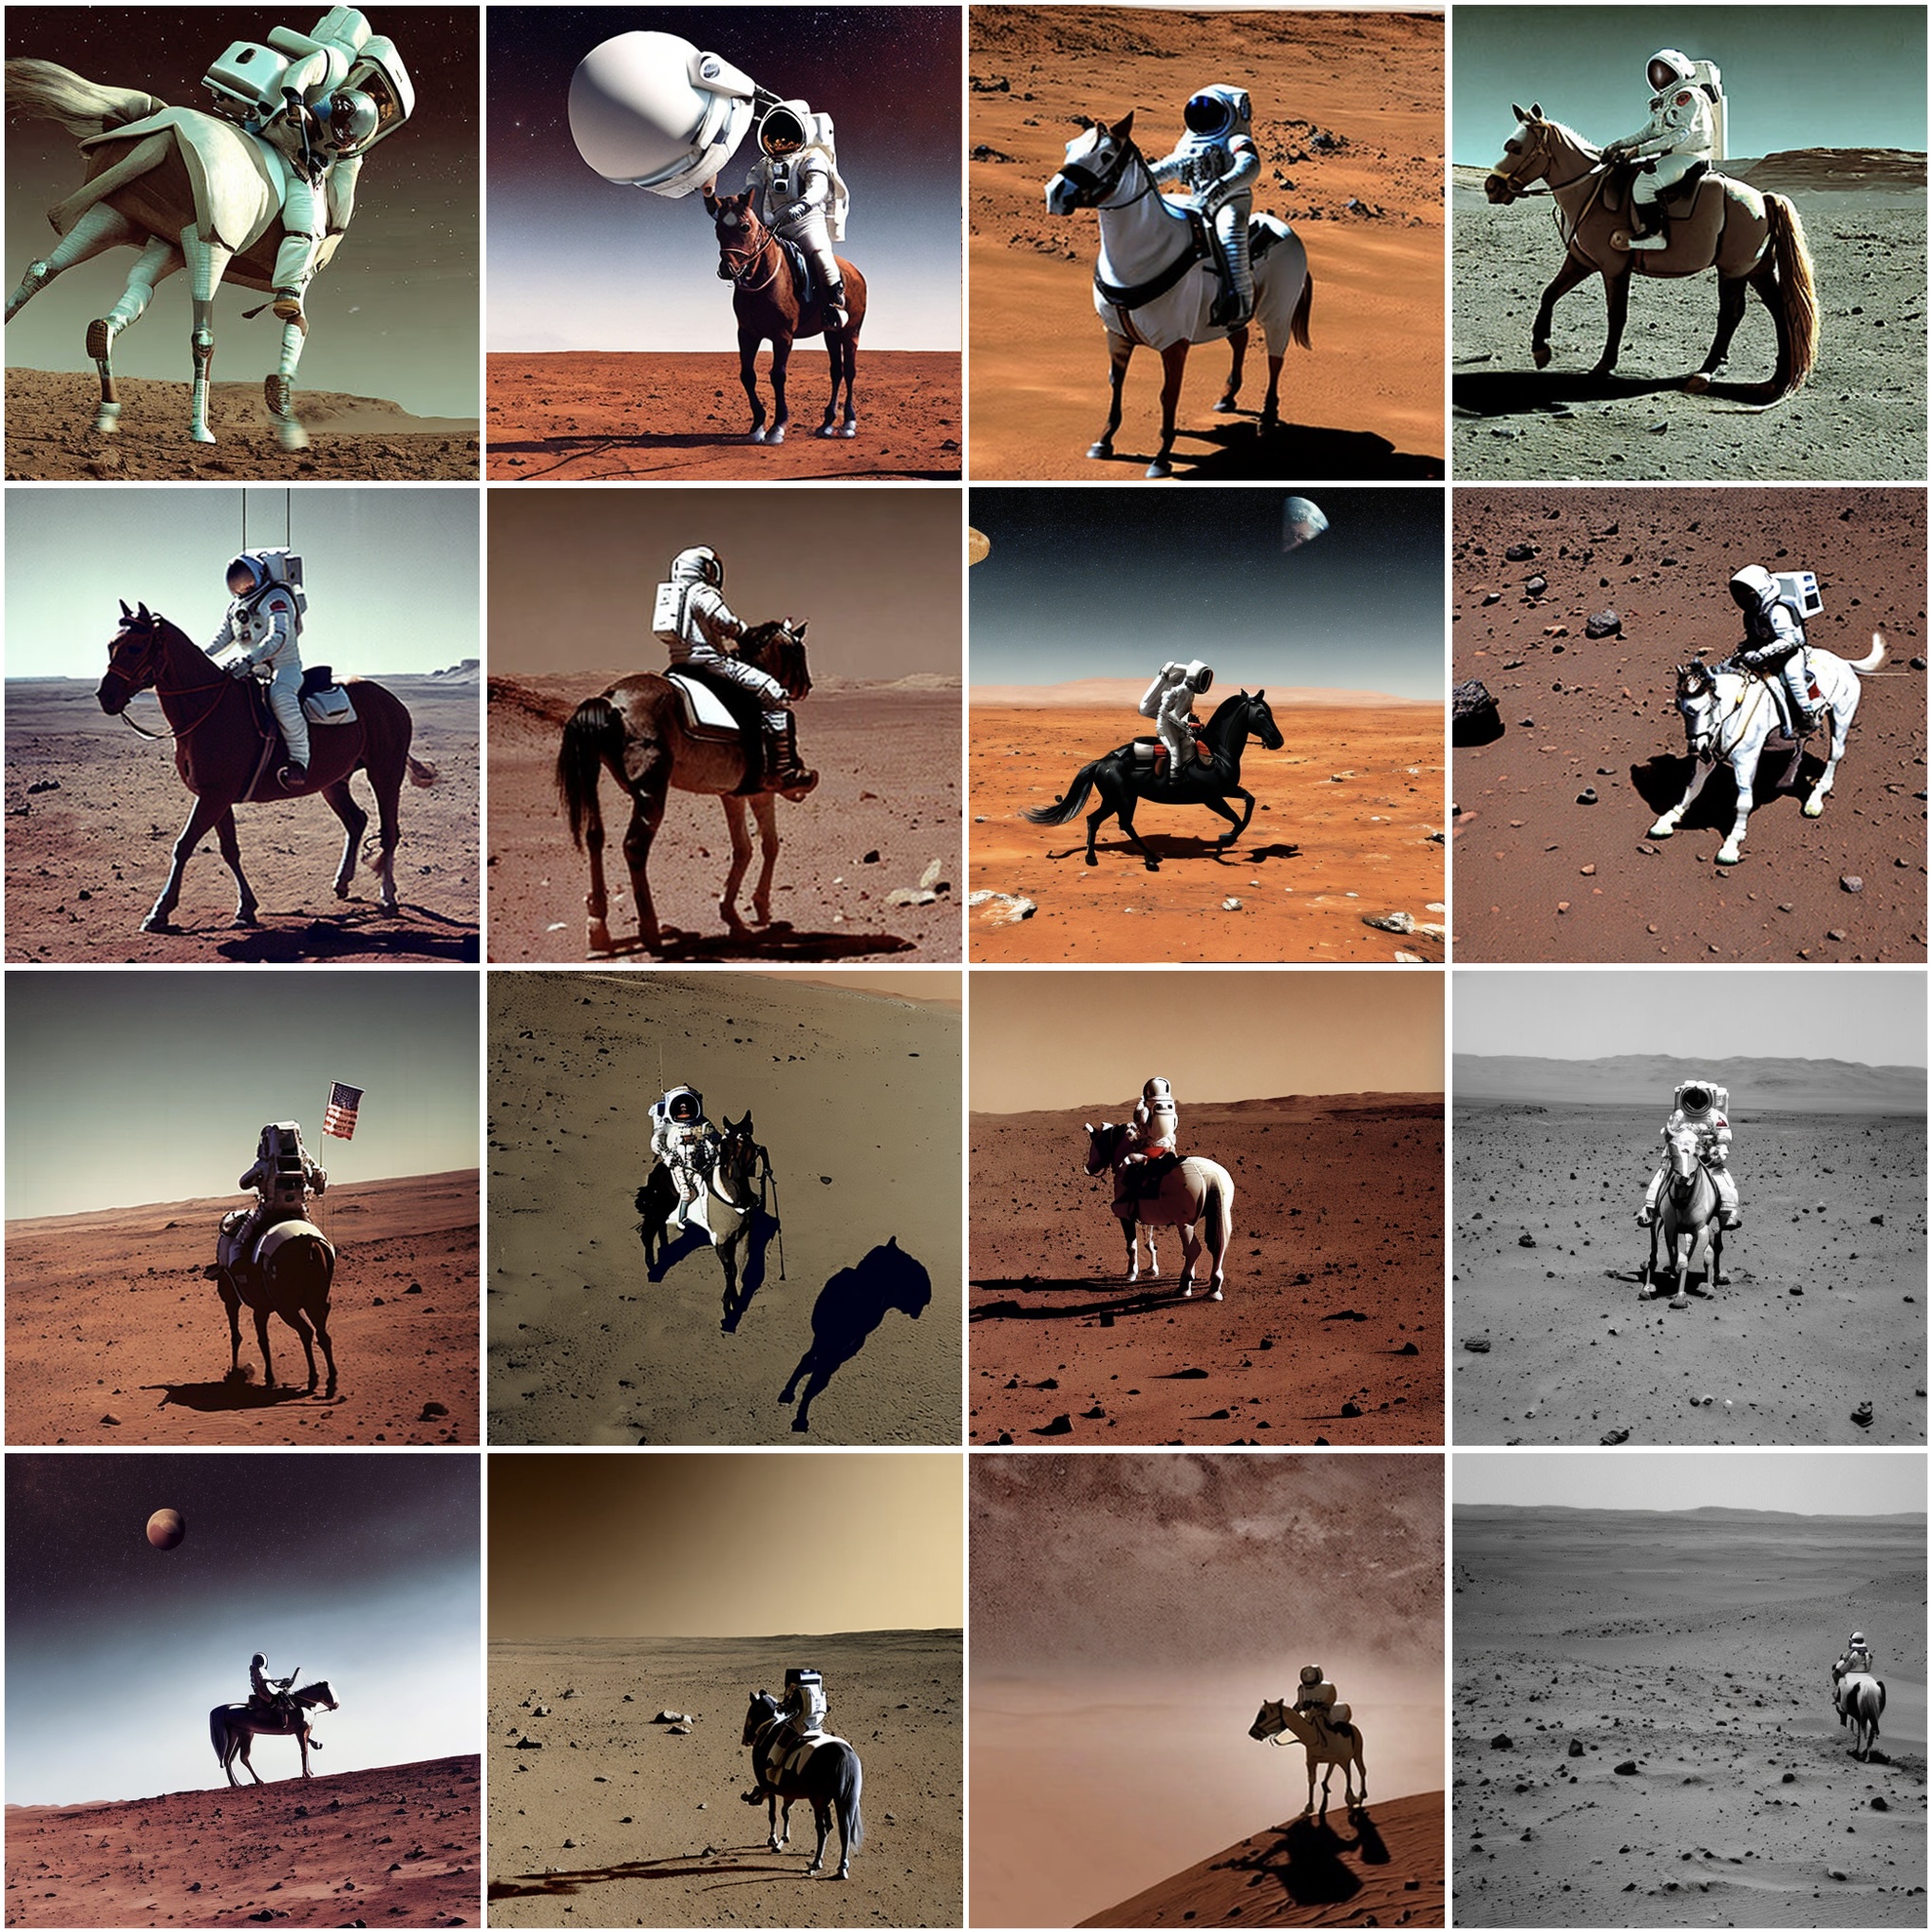
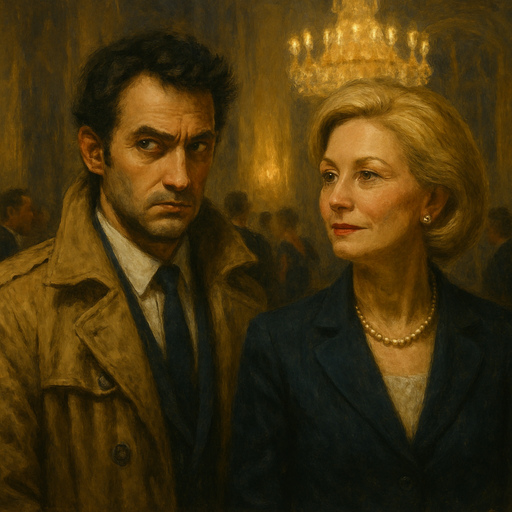
Incorporating Human Feedback into Quality Diversity for Diversified Text-to-Image Generation
Scaling CMA-MAE on the Sphere Benchmark
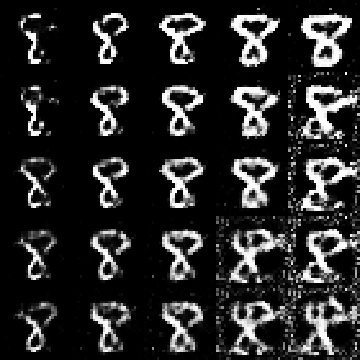
Illuminating the Latent Space of an MNIST GAN
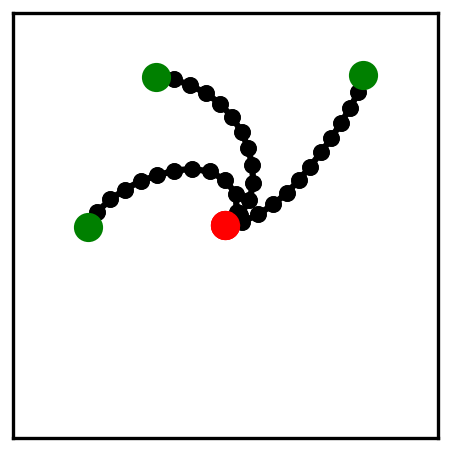
Learning a Repertoire of Robot Arm Configurations

Generating Images to Fool an MNIST Classifier